Performance
Understand what is happening in your restaurant.
Menly calculates your metrics from your real orders: what sells, when, through which channel and thanks to whom — compared with the period of your choice.
- Calculated from your orders
- Comparisons
- CSV export
Five dashboards
From today's revenue to service times.
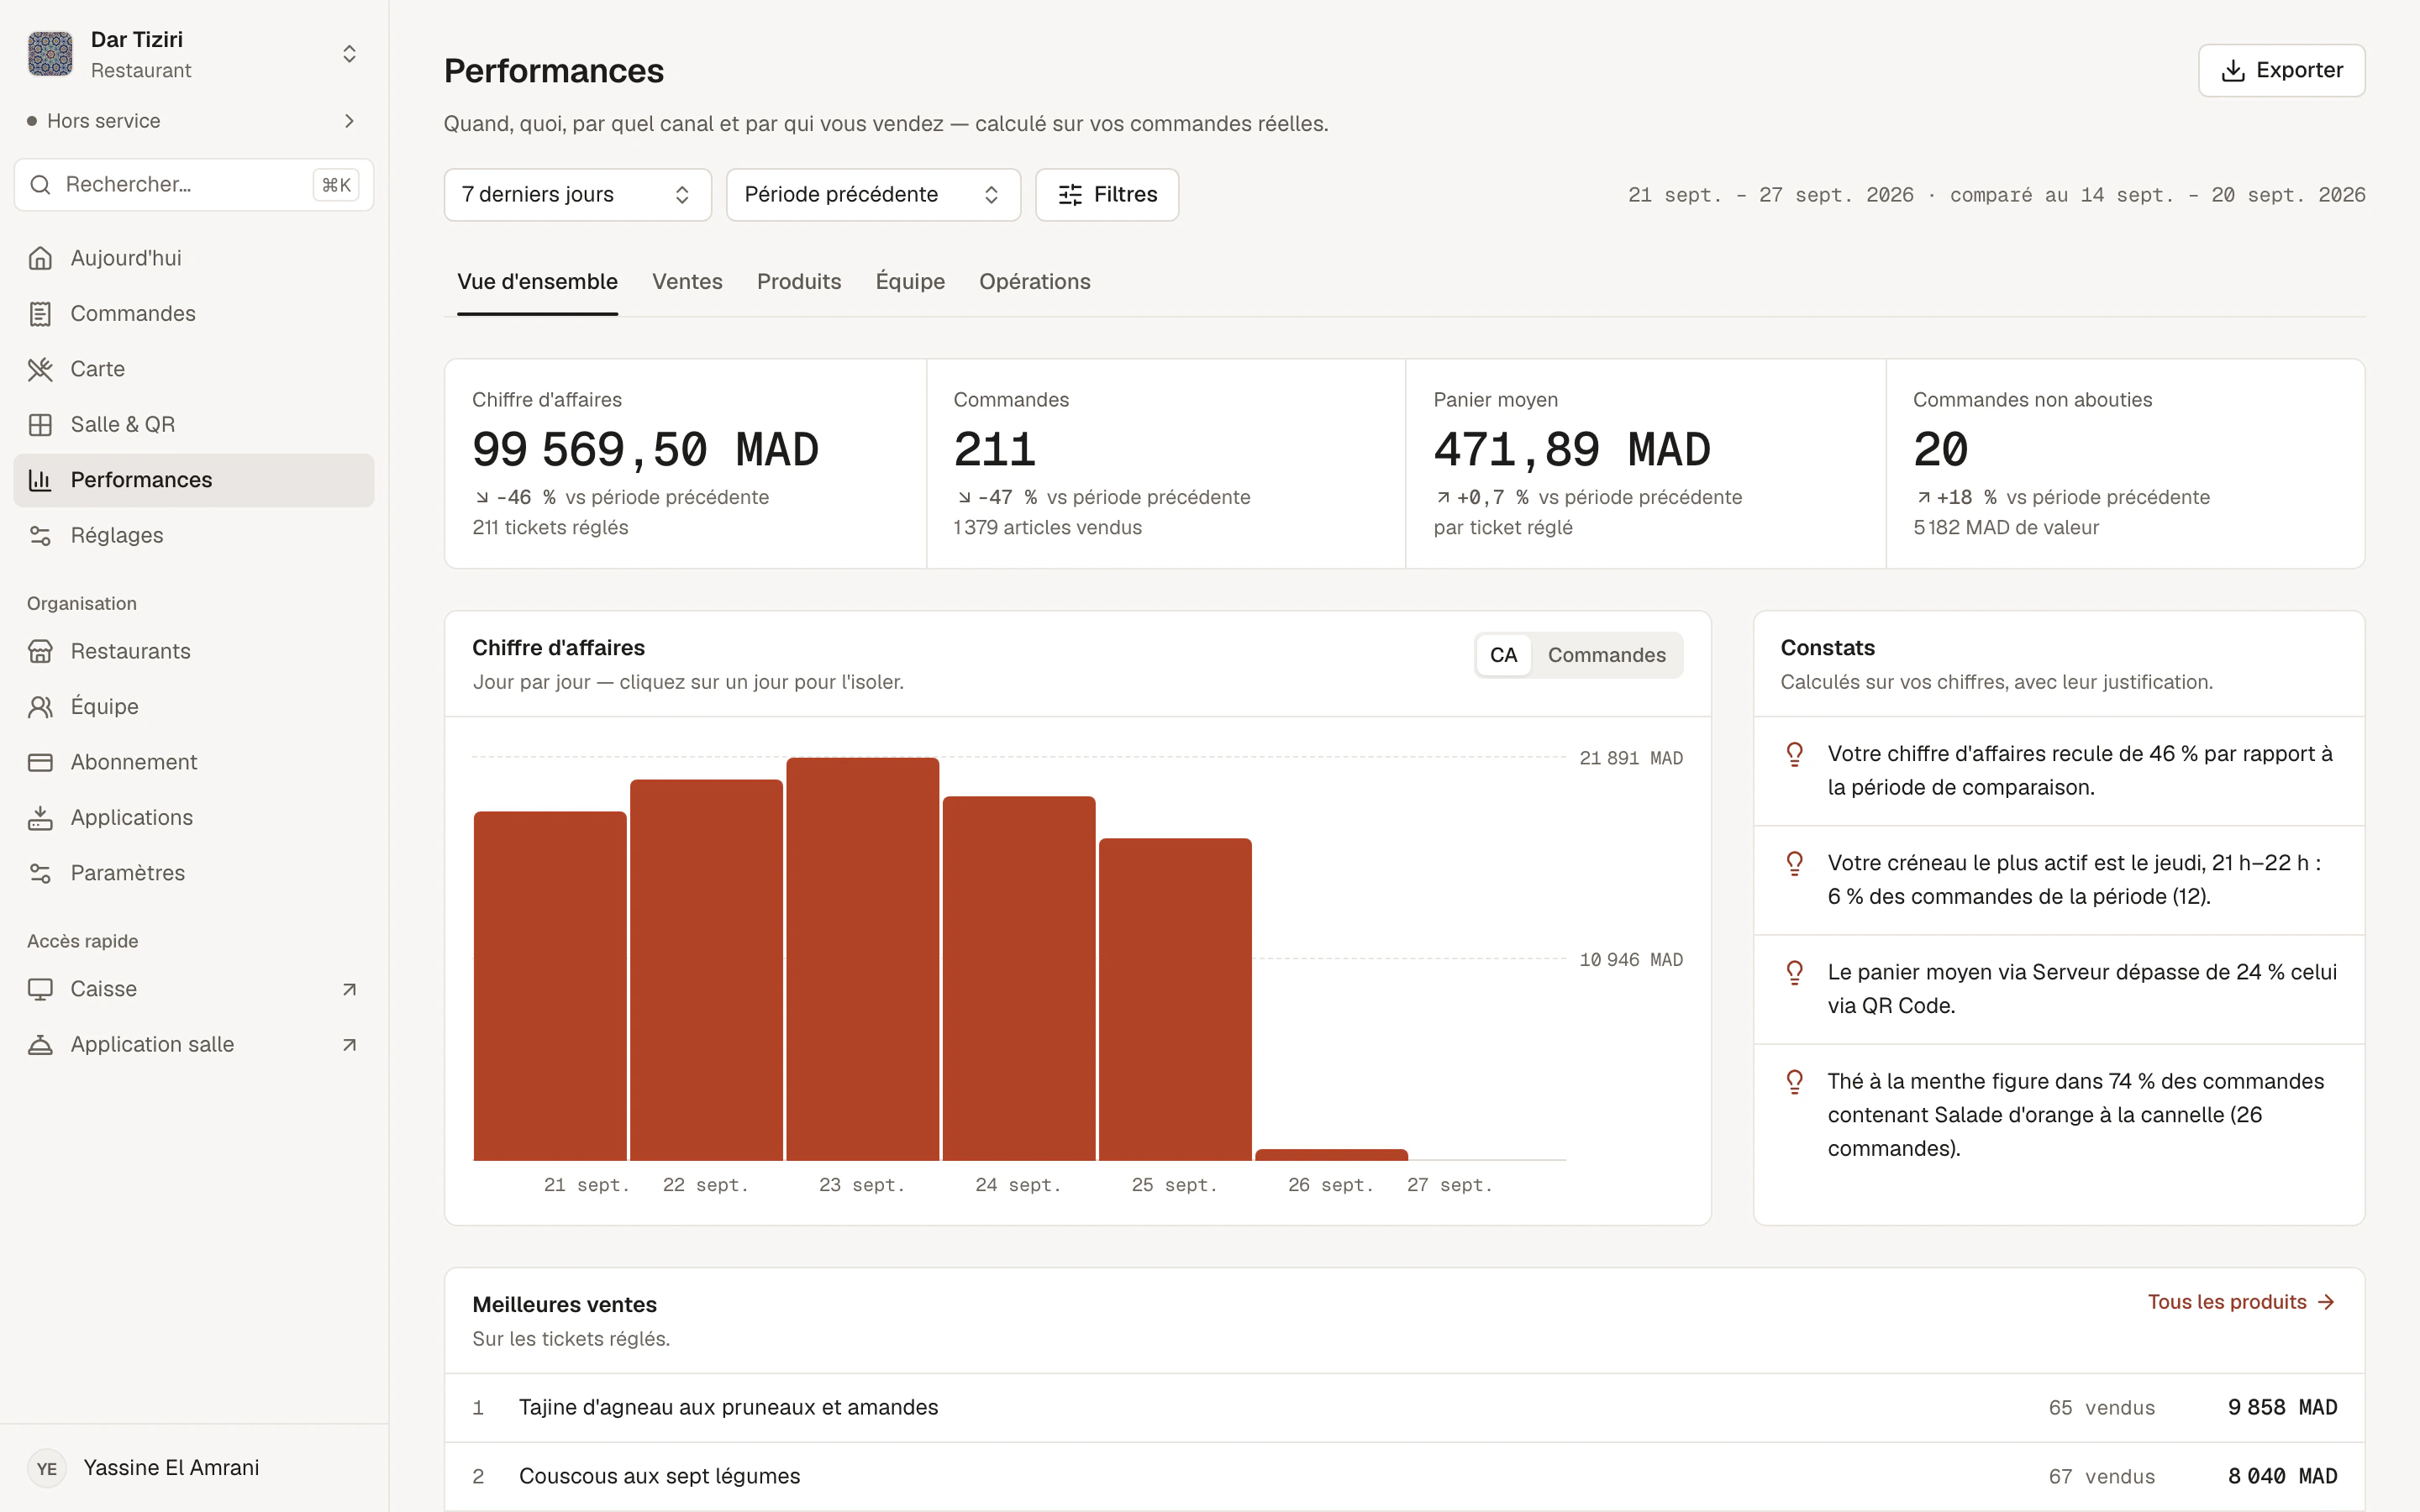
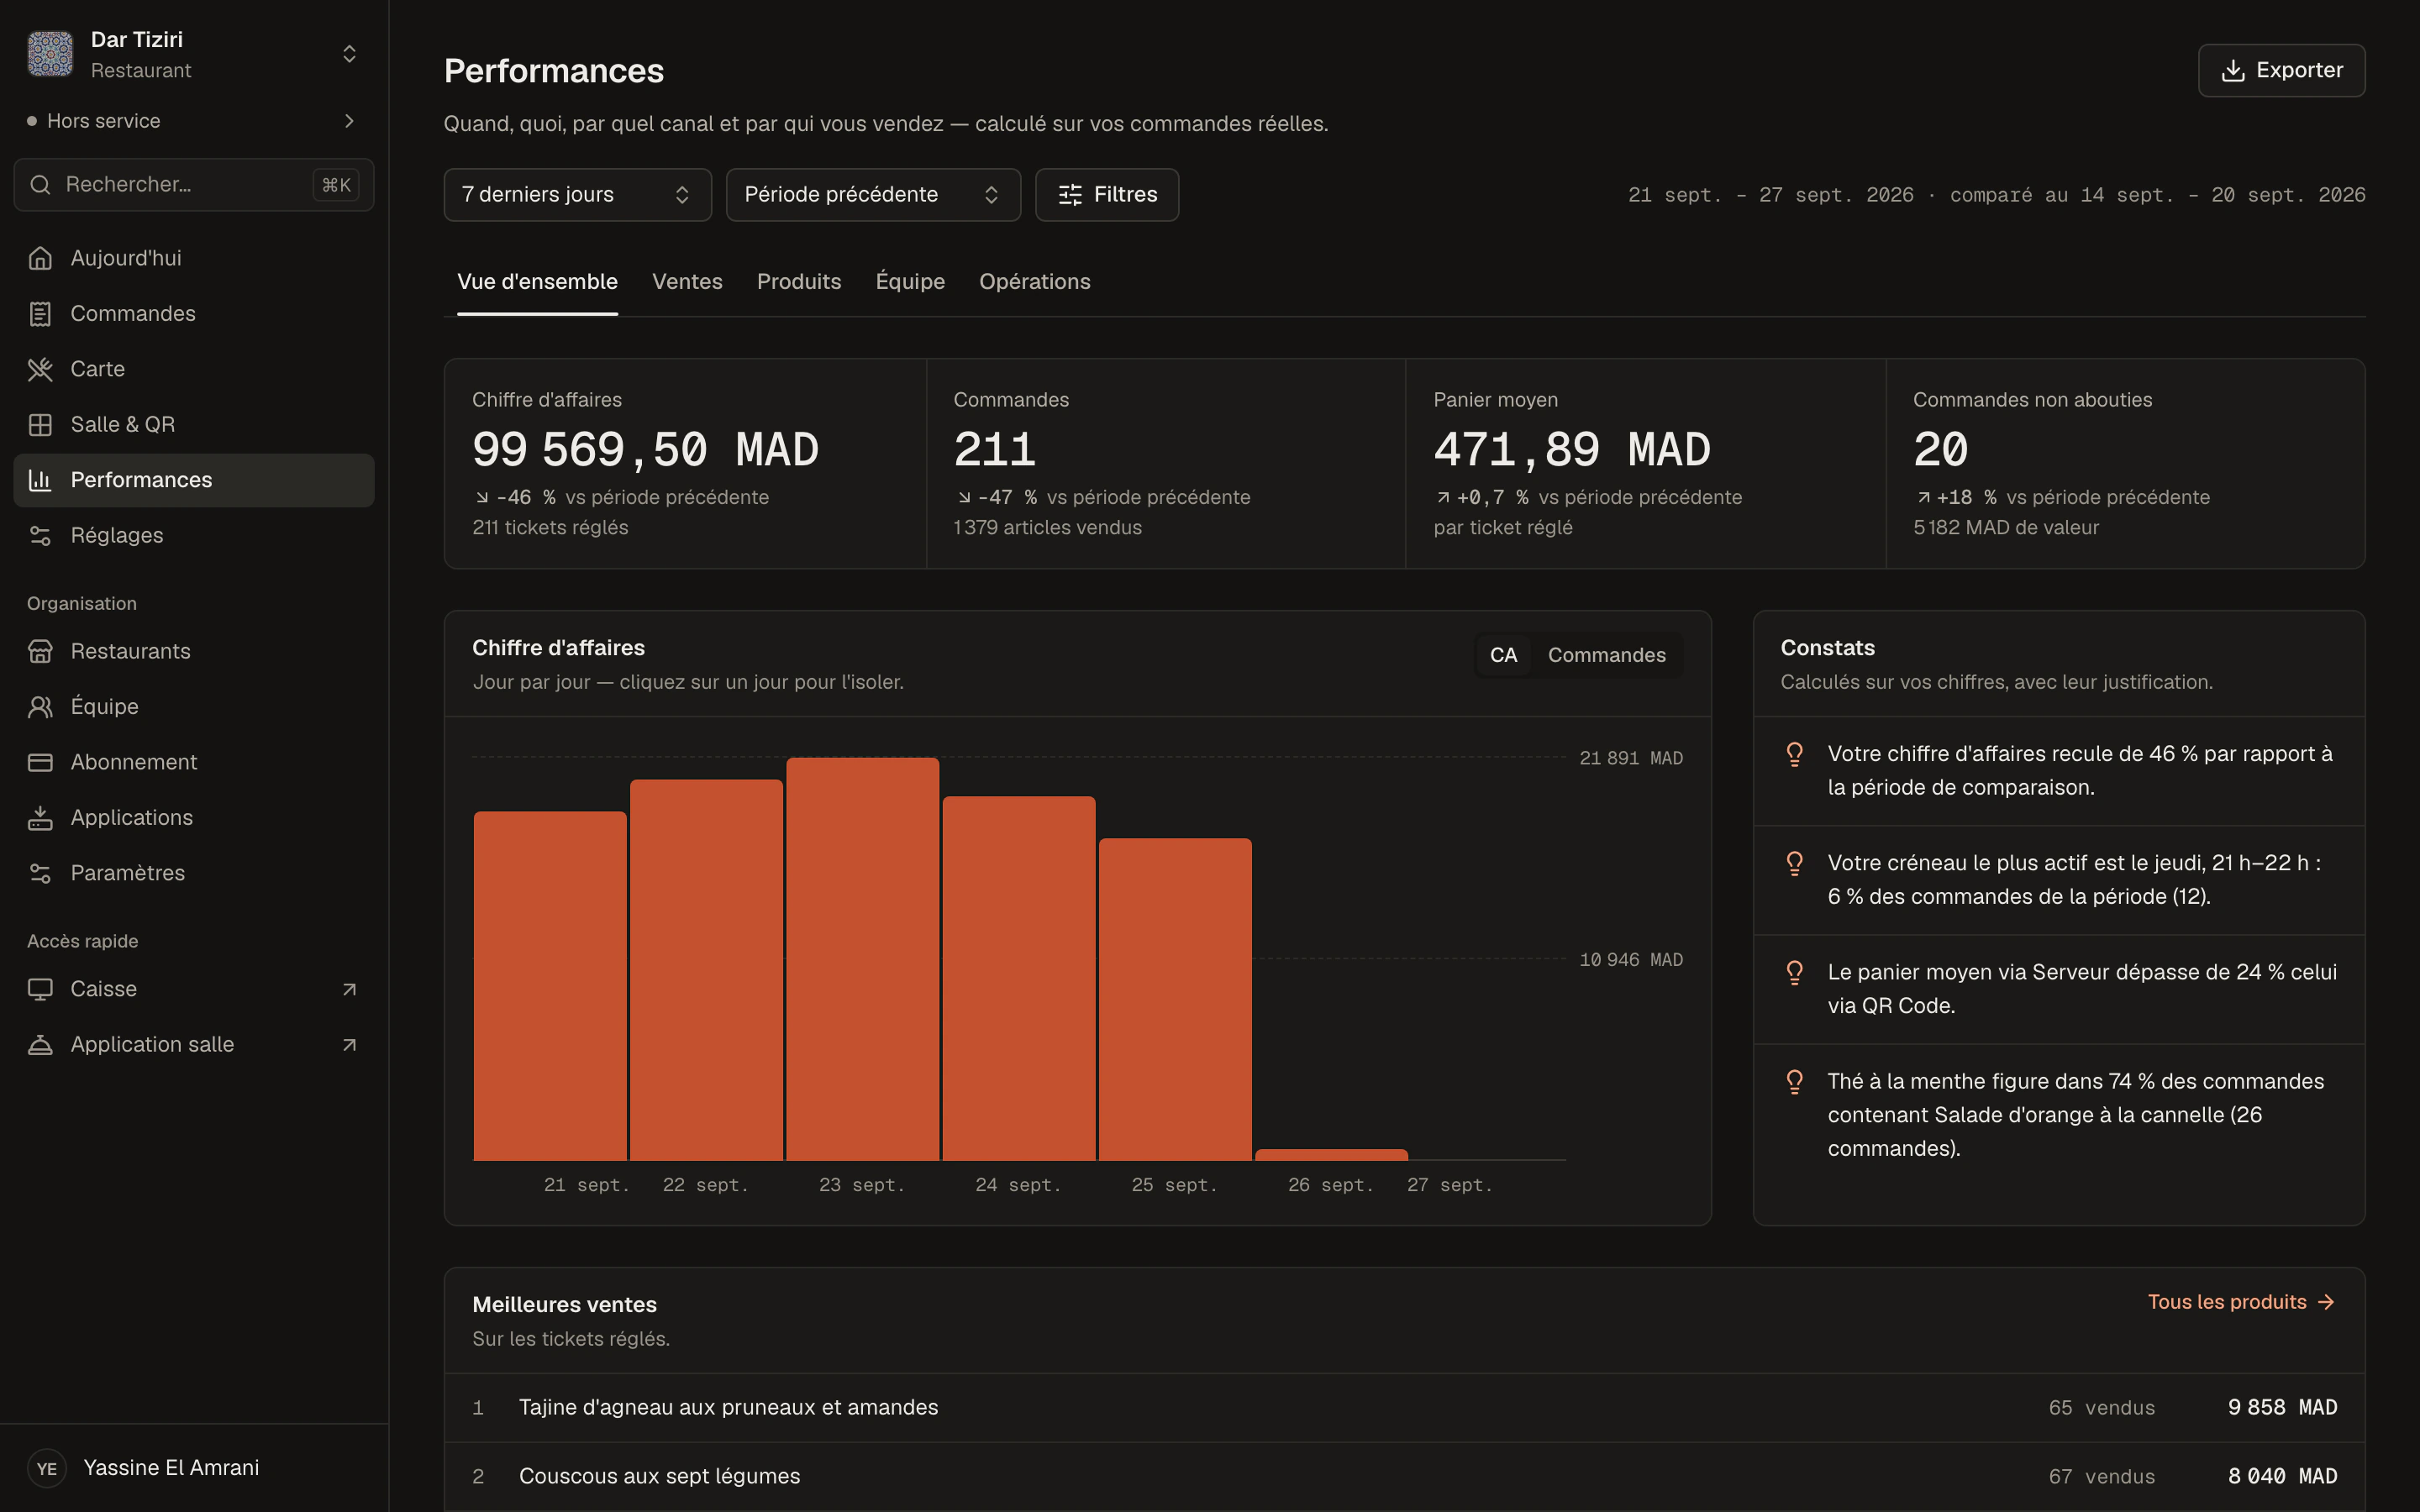
Overview
Revenue, orders, average ticket, items sold, cancelled or not completed orders, best sellers.
Sales
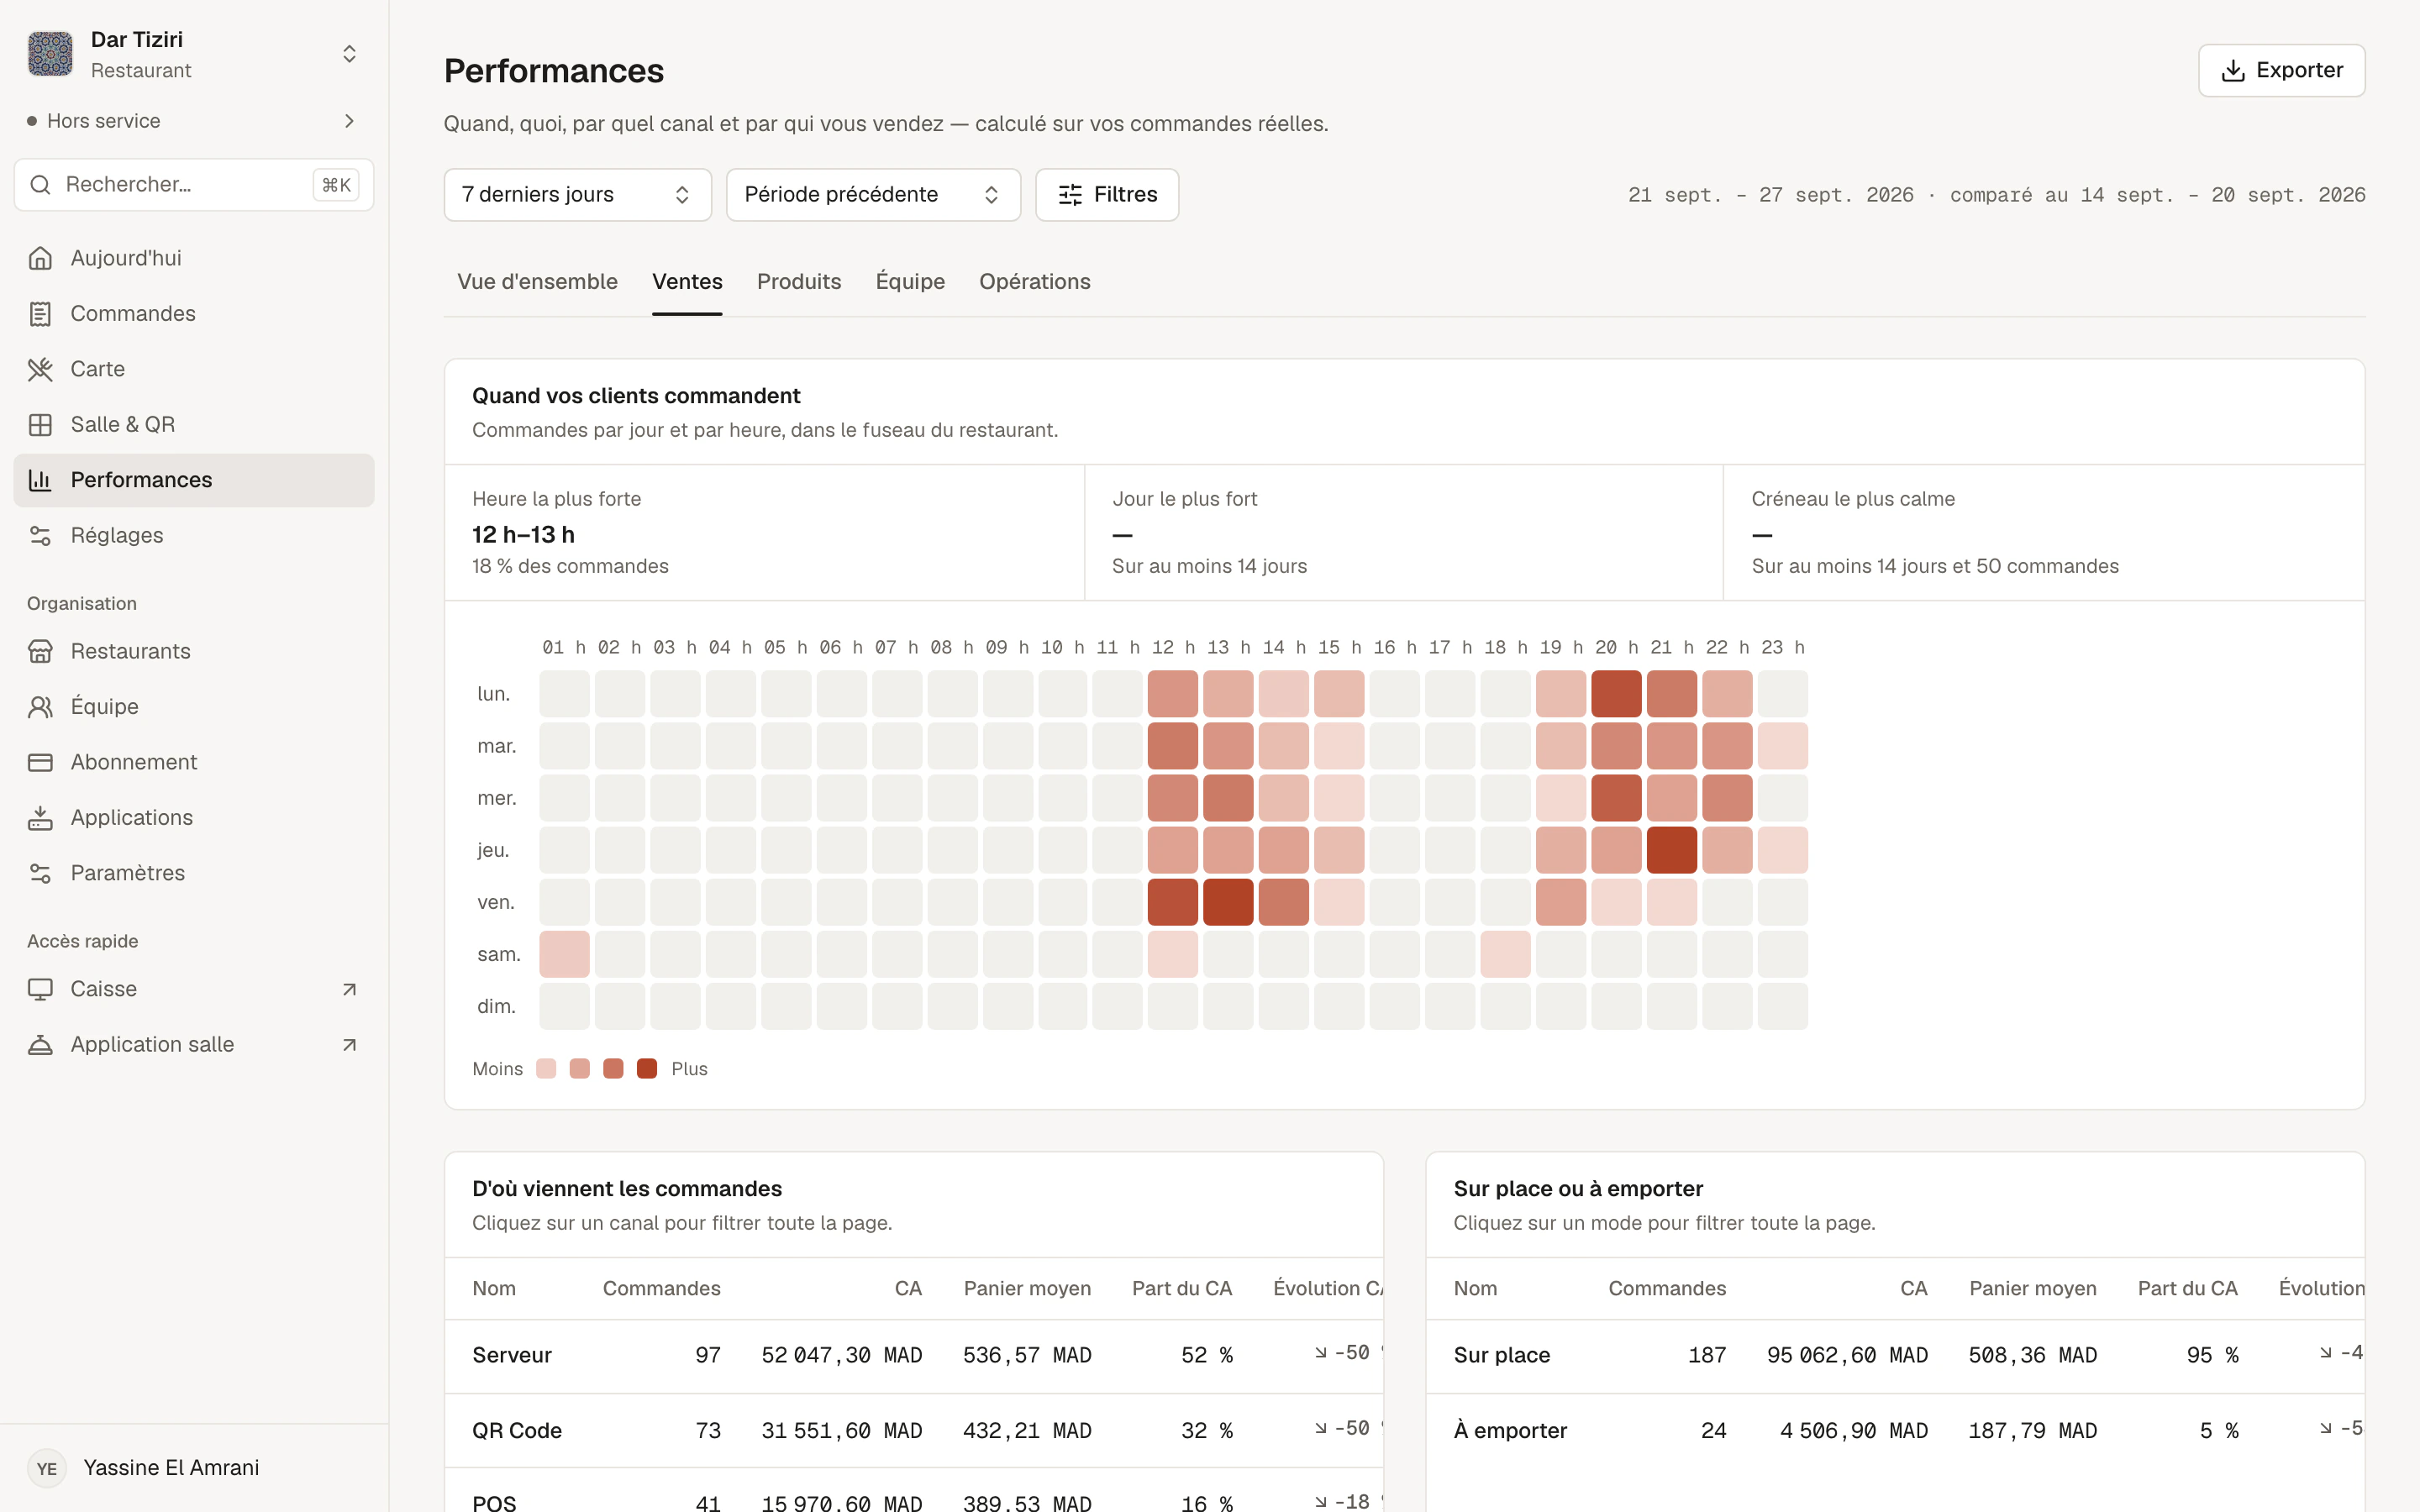
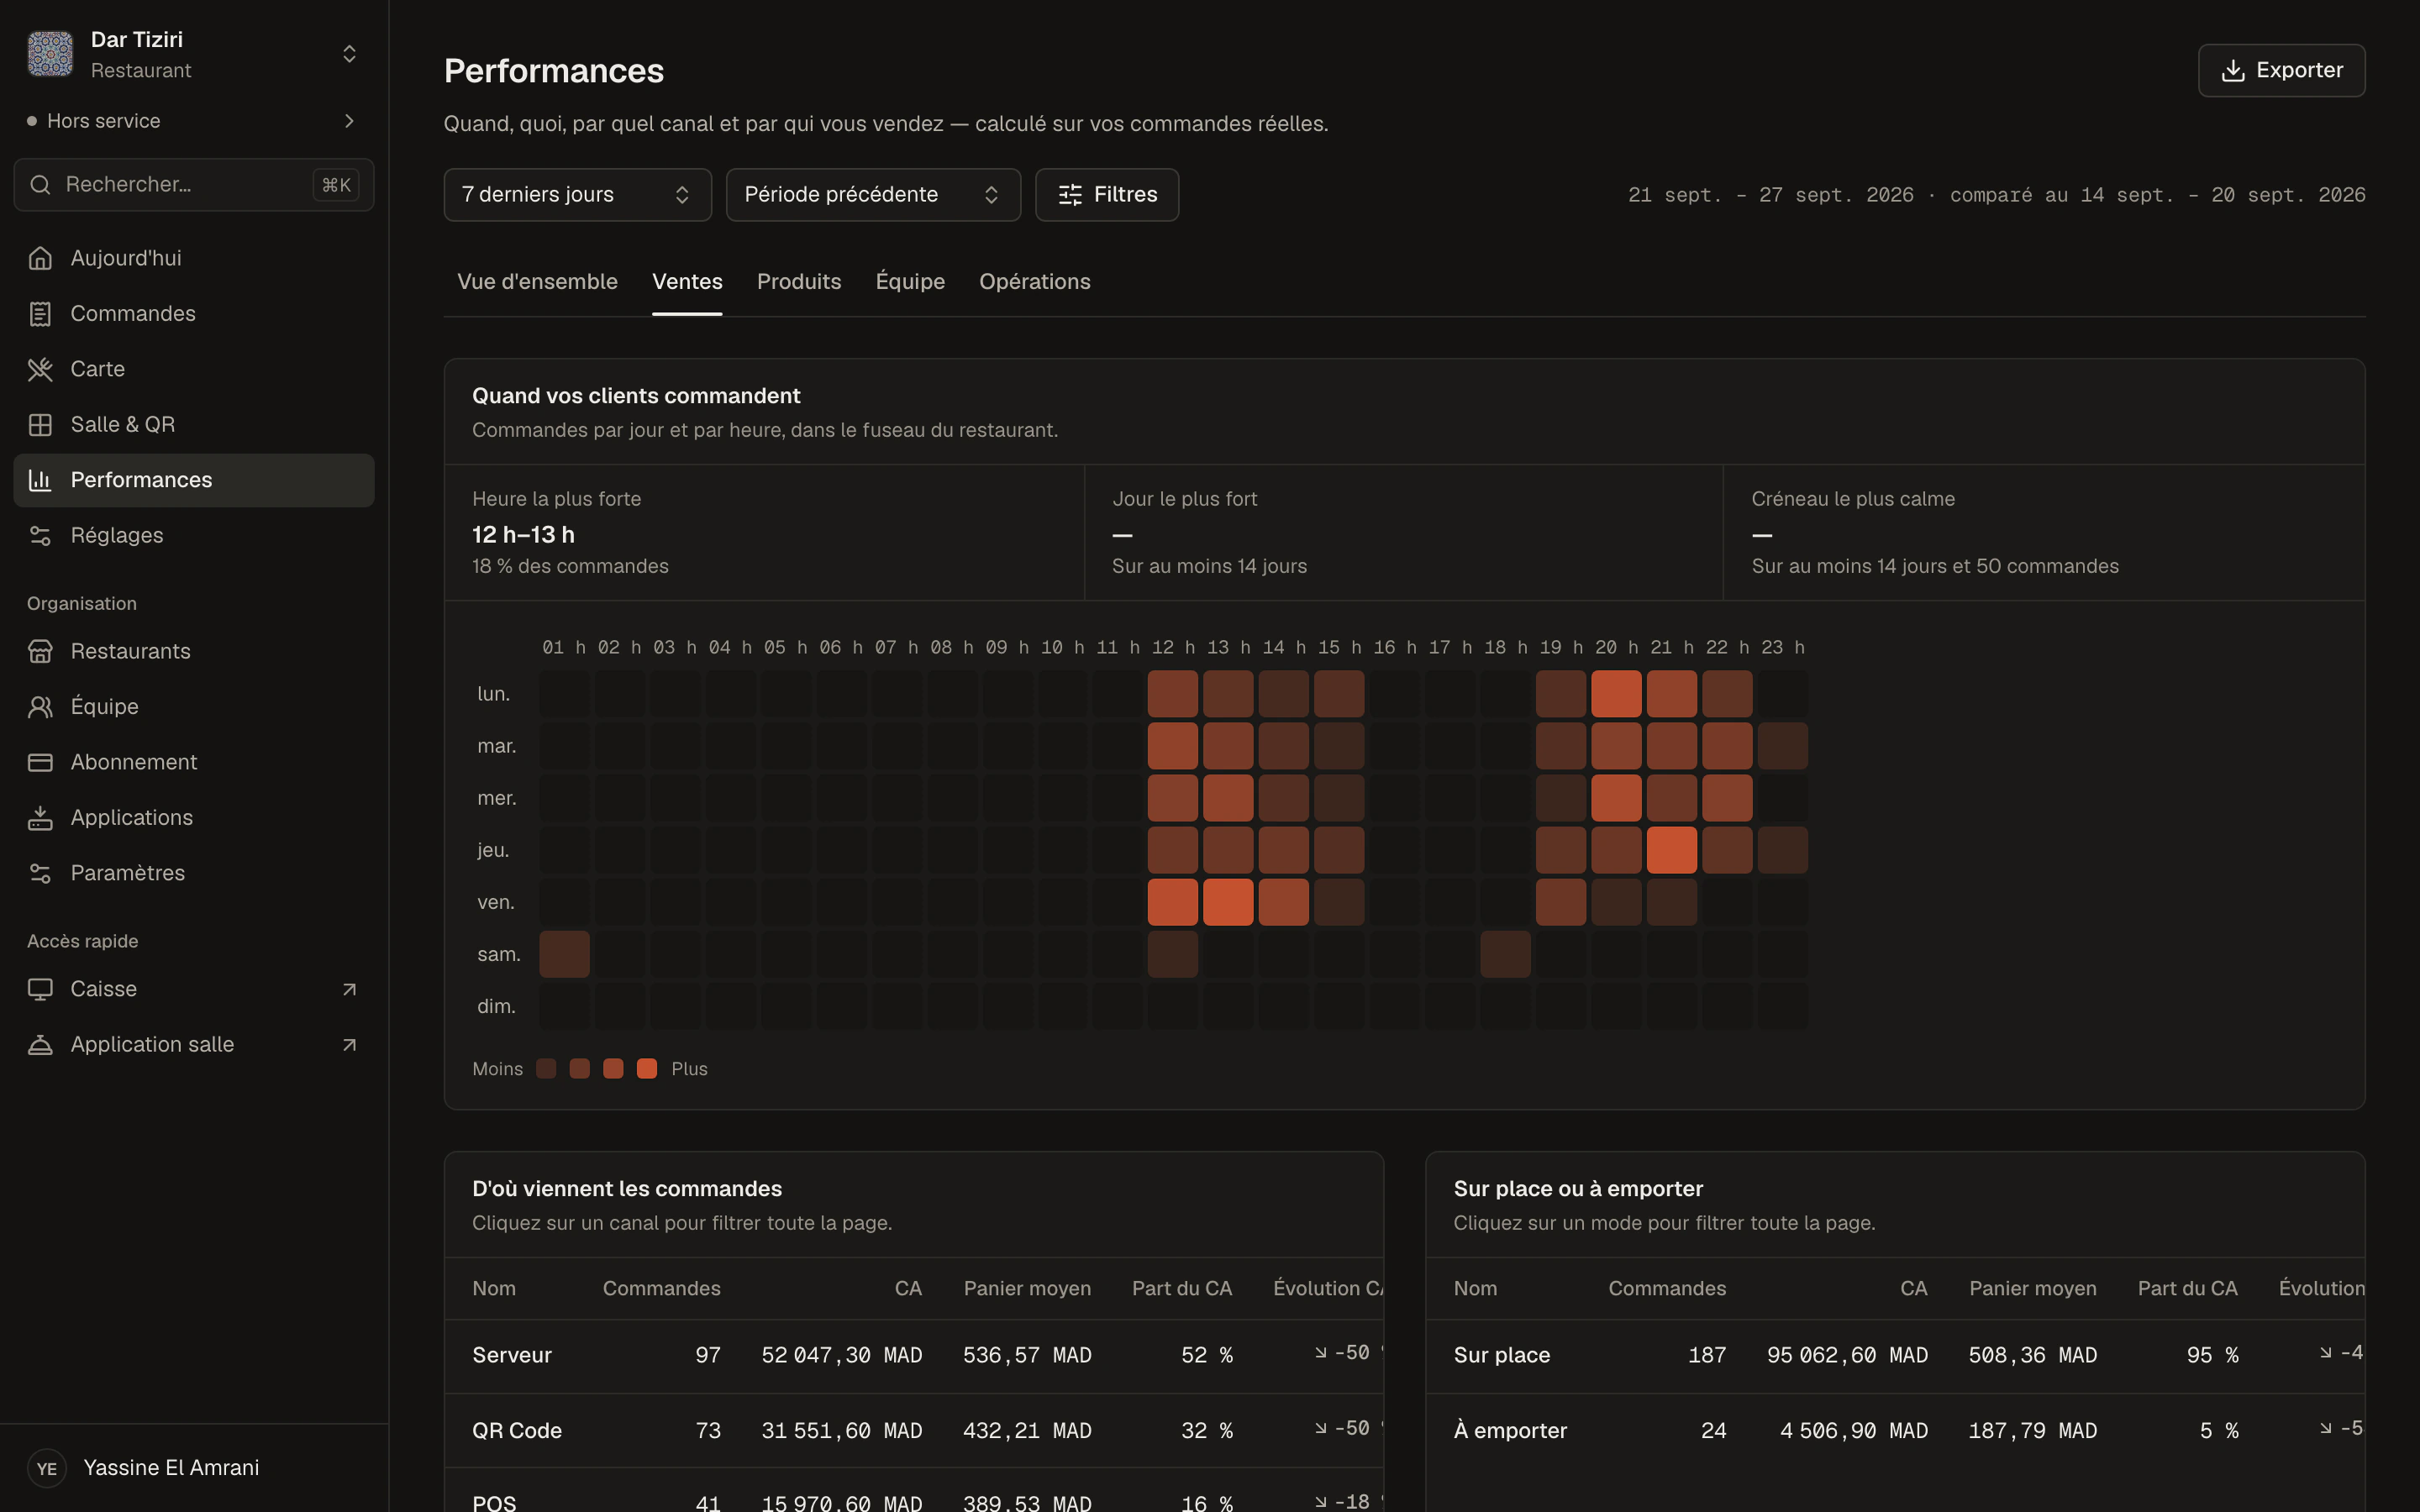
Day × hour heatmap, busiest hour and day, channels, dine-in or takeaway, payment methods, customer language.
Products
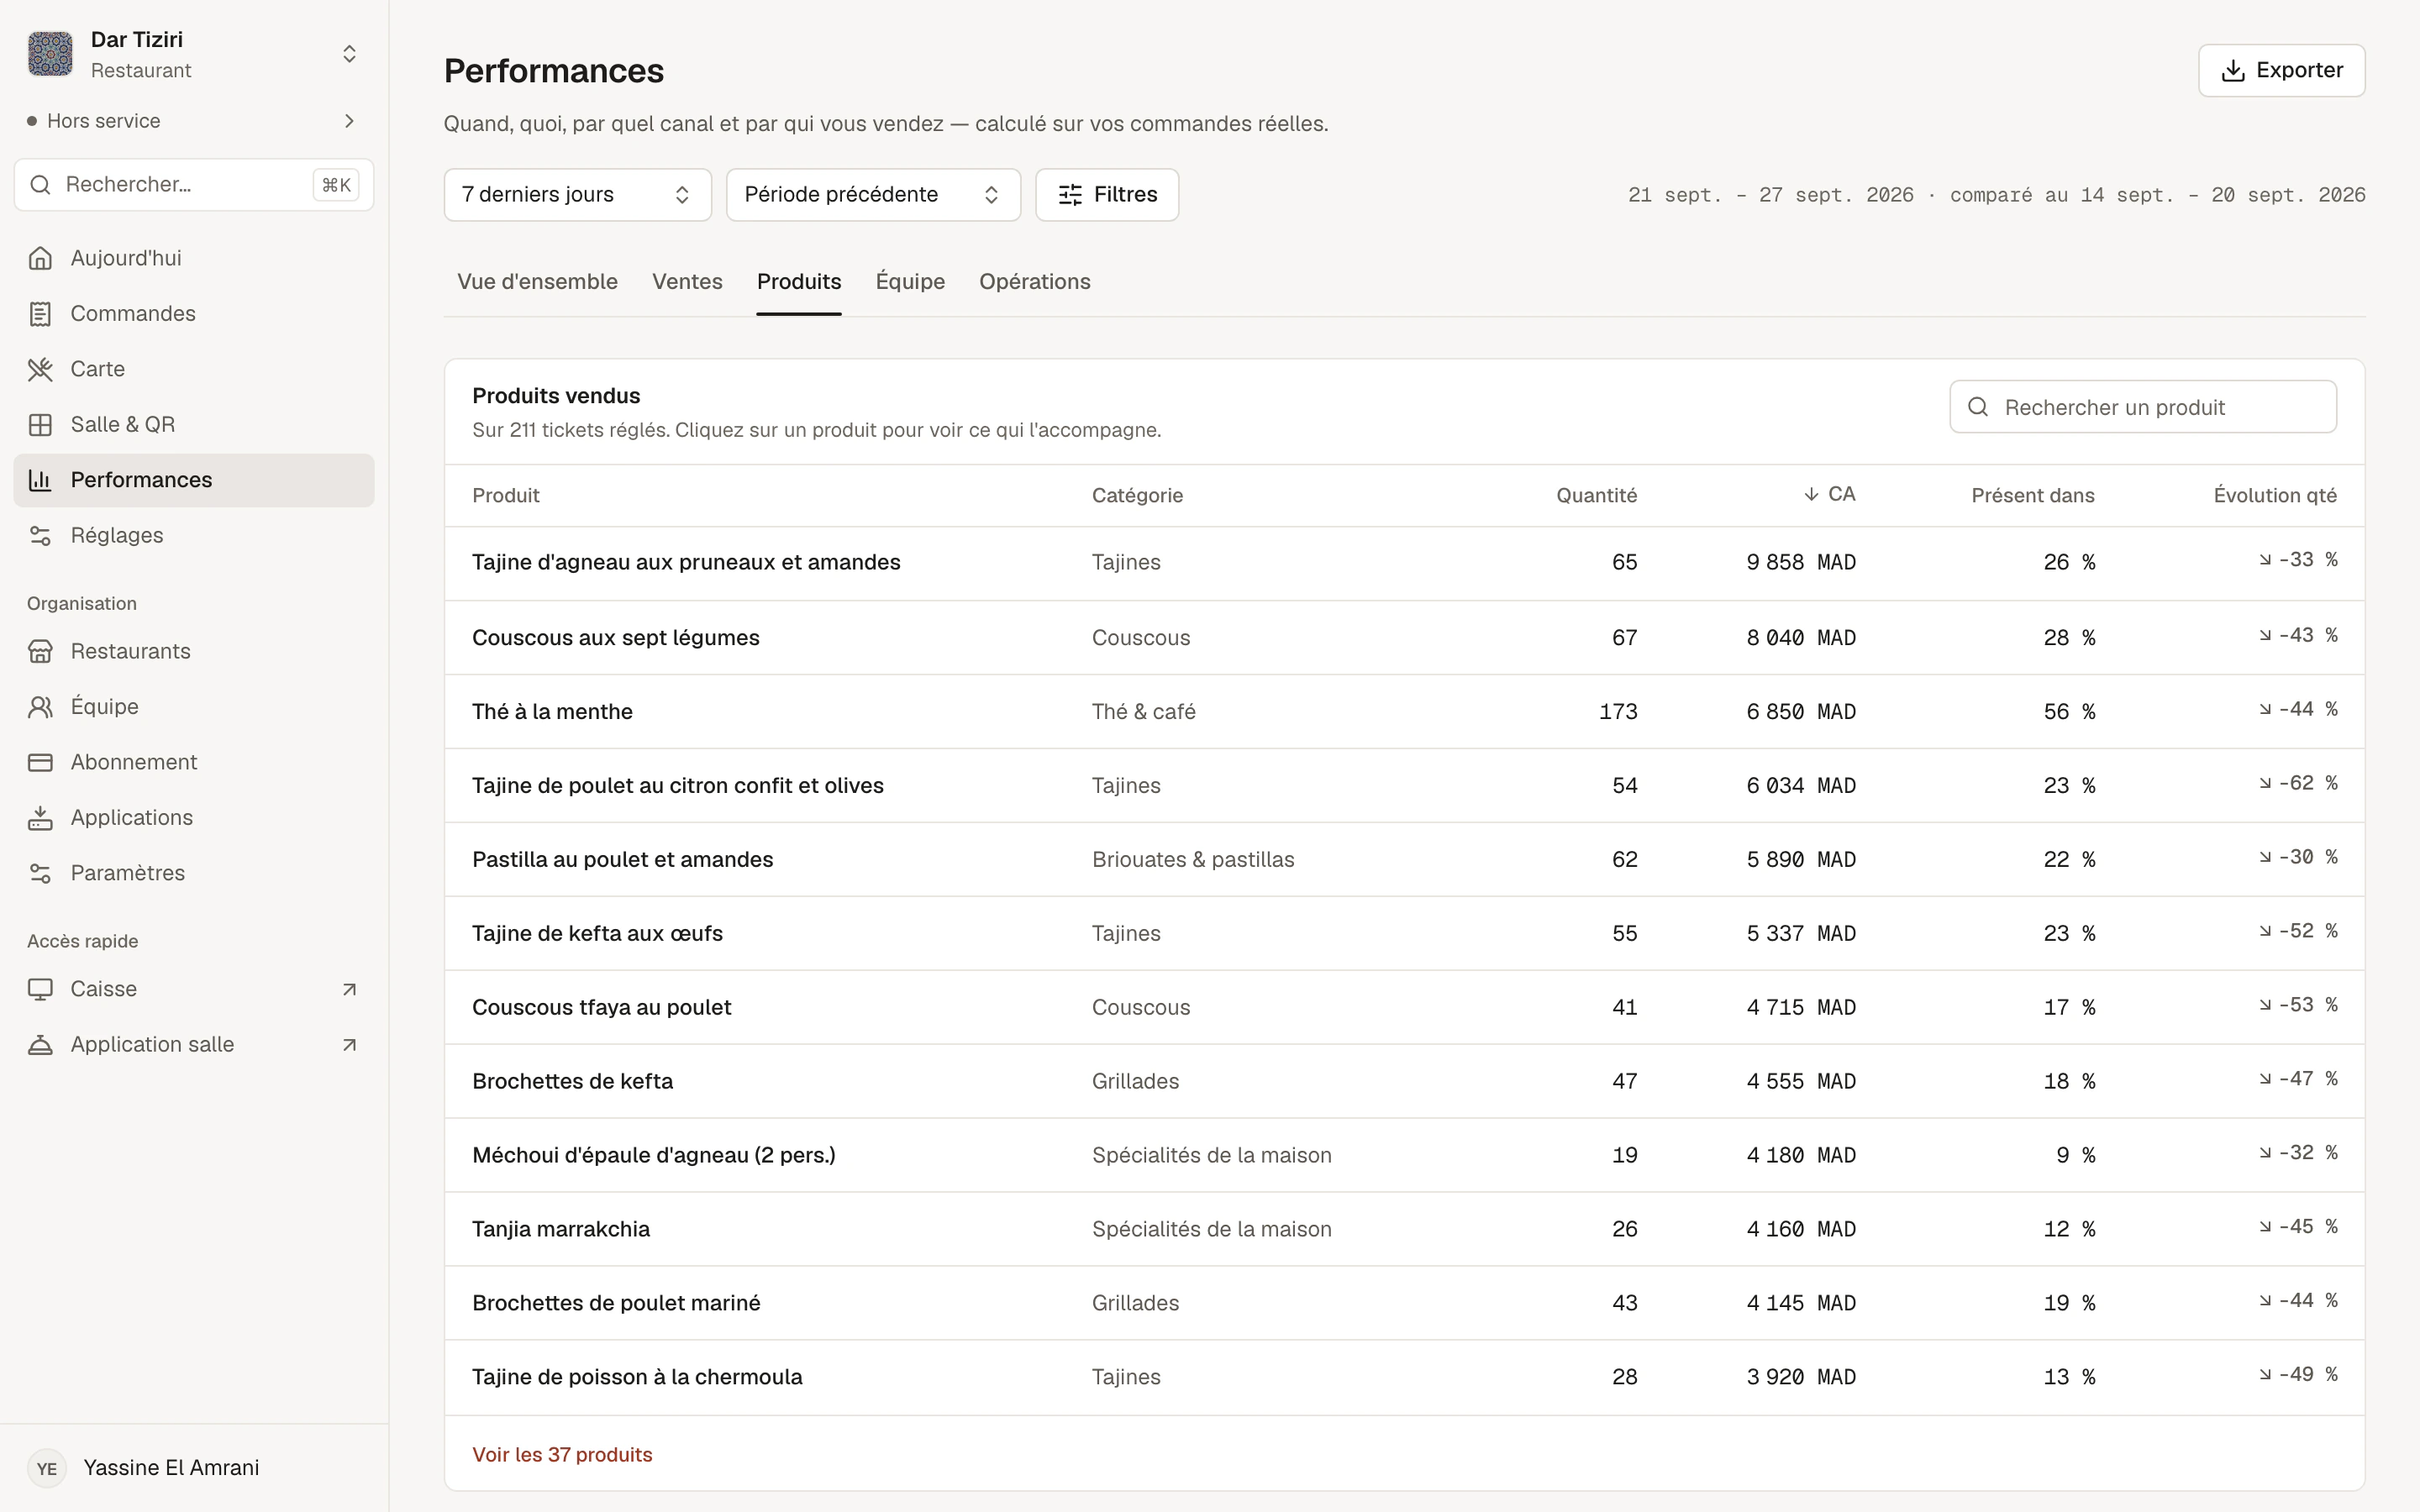
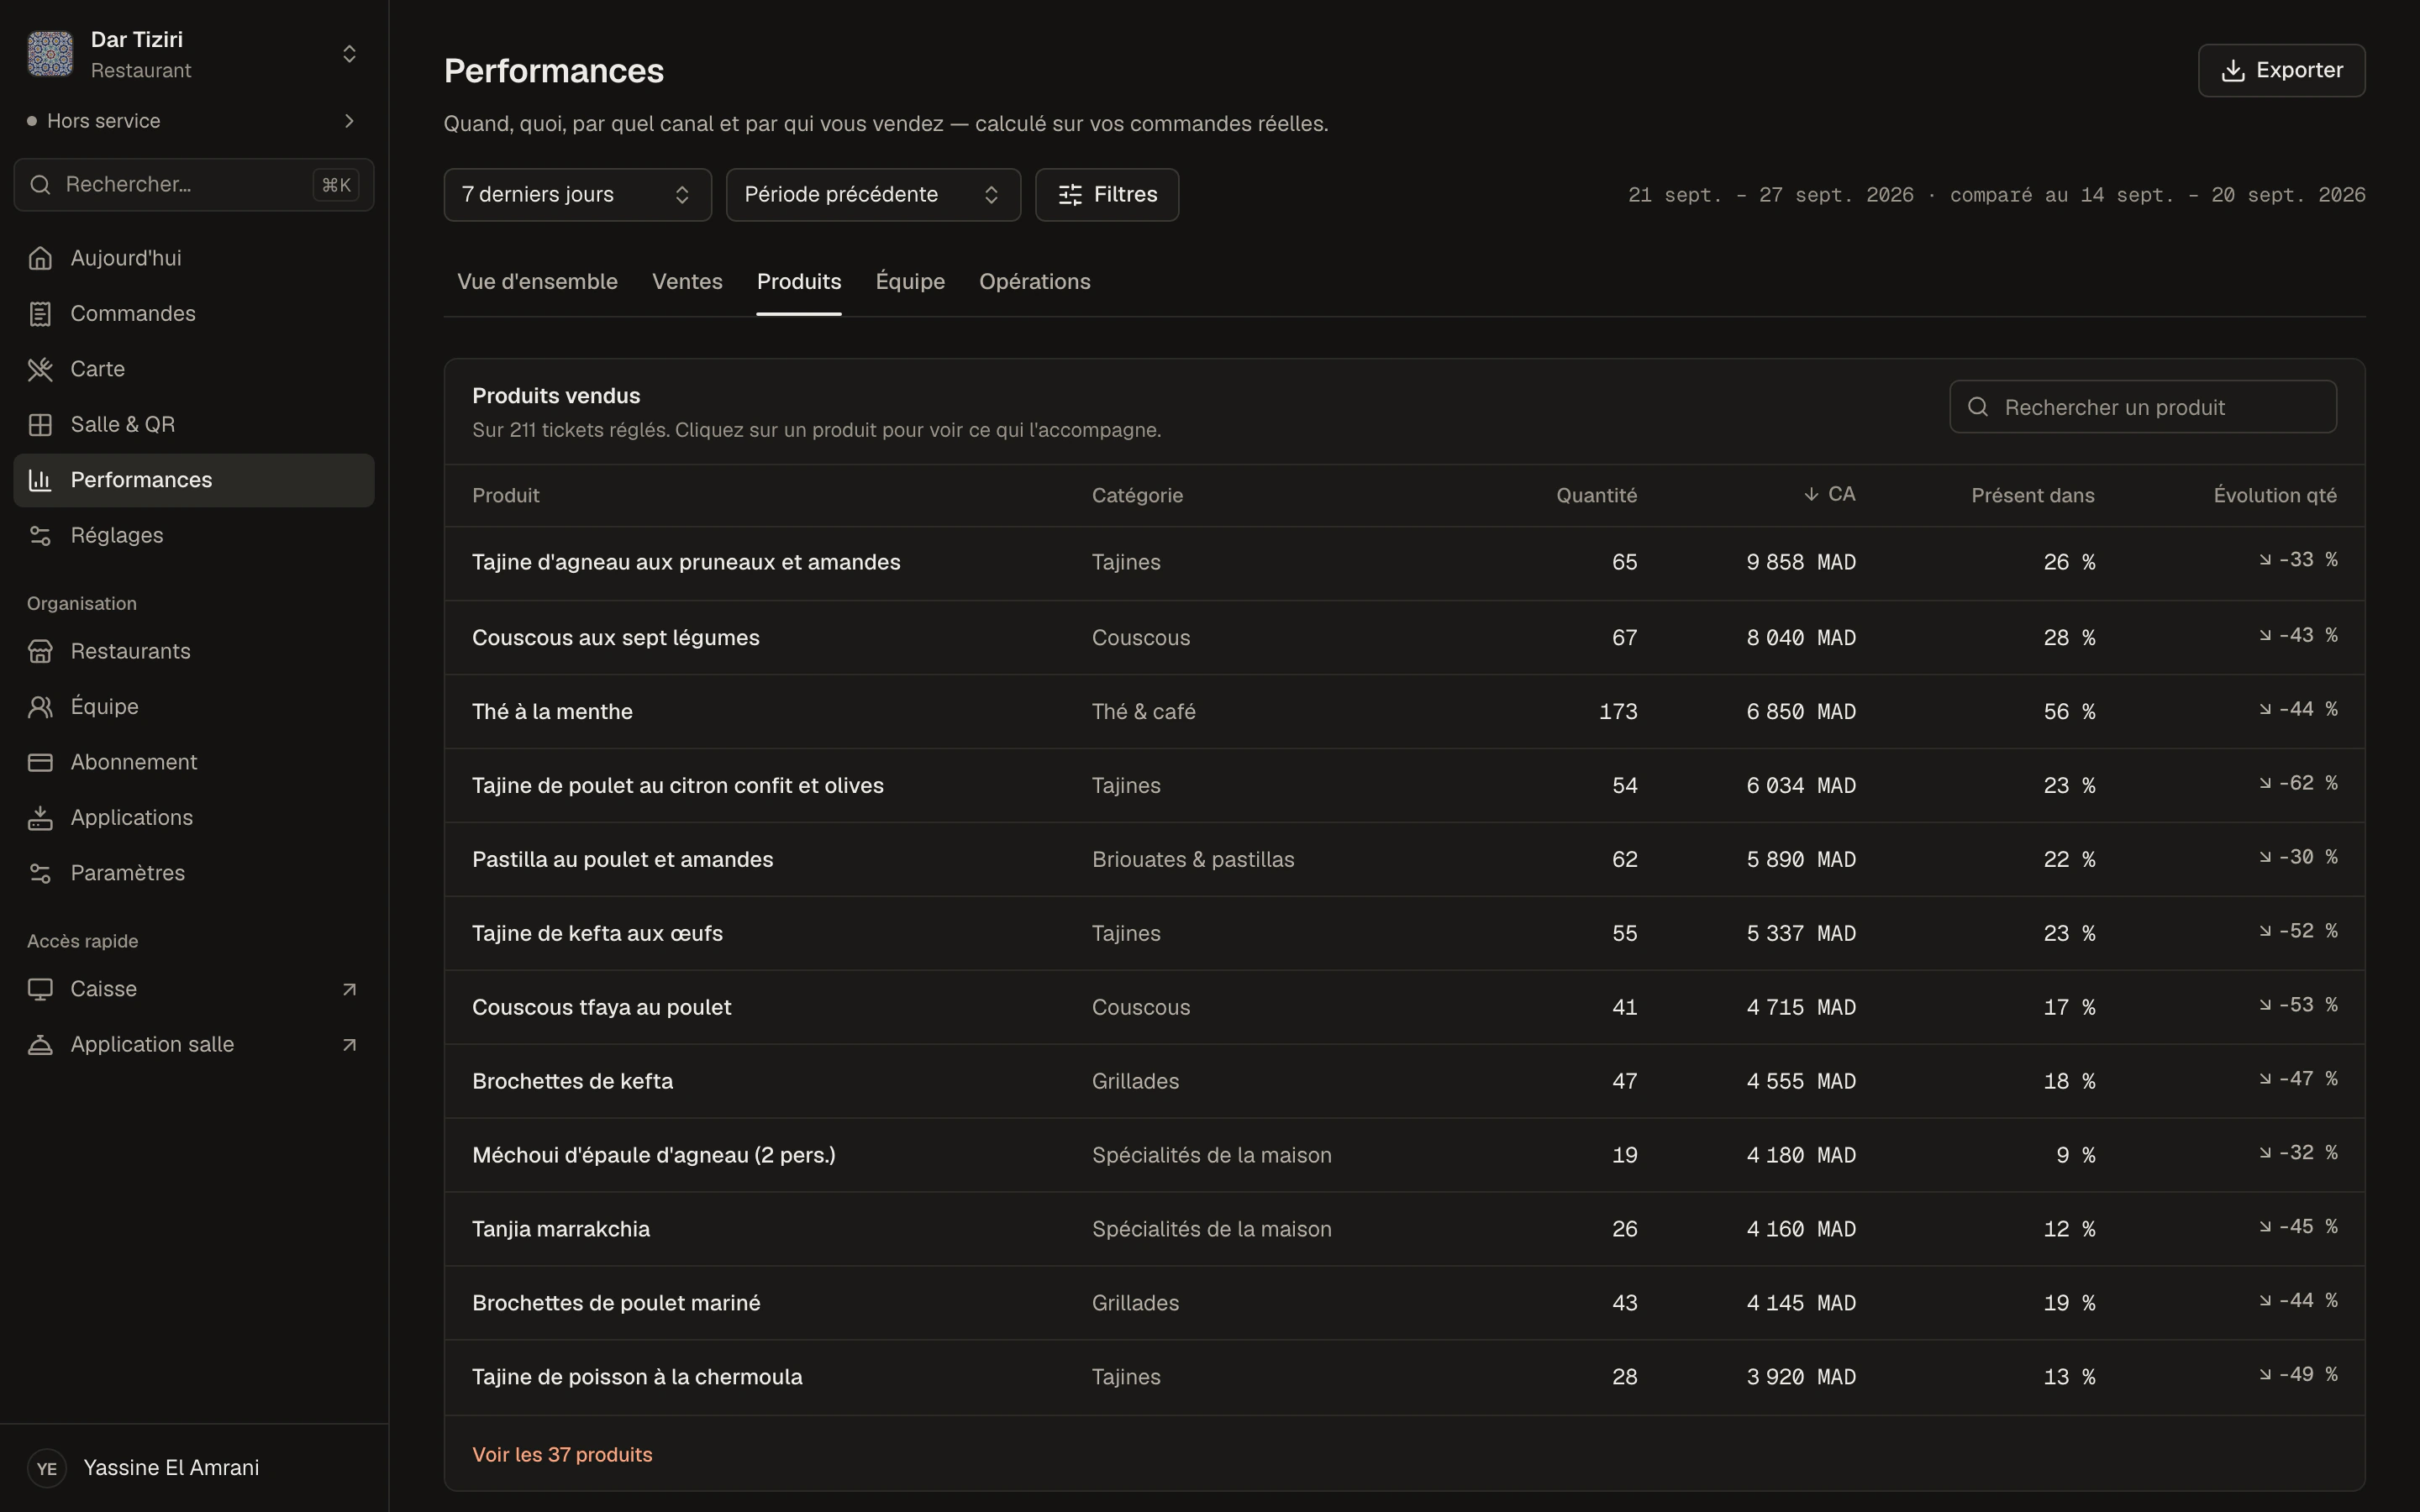
Quantities and revenue by product and by category, options chosen, products ordered together, products never sold.
Team
Per member: orders taken, revenue, average ticket, payments, tables closed, discounts, cancellations.
Operations
By service, by space and by table; median times to confirm, prepare, serve and take payment.
Sales
See your peak hours at a glance.
The heatmap crosses the days and hours of the week, in the restaurant's time zone. You see when to add staff, when to run an offer, which channels bring in the most.
- Busiest hour and quietest slot
- Breakdown by channel and by mode
- Clicking a channel filters the whole page
Products
What sells, and what sells together.
Rank your products by quantity or by revenue, see their trend, the most chosen options and the products most often ordered together — useful for your set menus and suggestions.
- Share of orders
- Associated products and association rate
- Products never sold in the period
Filters
The right question, the right filter.
Period
- Today, yesterday
- 7 or 30 days
- This month, last month
- Custom period
Comparison
- Previous period
- Same period last year
- No comparison
Filters
- Channel
- Dine-in or takeaway
- Service
- Member
- Menu
Findings
Findings written for you, with their reasoning.
Menly spots what deserves your attention — the busiest slot, the strongest day, the ticket gap between channels, the products that sell together, the revenue trend — and writes it in one sentence, backed by figures.
- Calculated over the chosen period
- Always shown with the figures
- No estimates: only your orders
The Sales and Team dashboards are included from the Standard plan; Operations and CSV export from the Pro plan.
Performance questions
Where do the figures come from?
From your orders recorded in Menly — QR code, till and servers. Revenue is calculated on paid tickets.
Can I export my data?
Yes. Orders, products and team export to CSV, from the Pro plan.
Can I see each server's performance?
Yes, in the Team dashboard: orders, revenue, average ticket, discounts and cancellations per member.
Are cancelled orders counted?
They are counted separately, with orders not completed, so that your revenue reflects paid tickets only.